StackSats on Nostr: I rarely post technical content, as I prefer focusing on #Bitcoin fundamentals rather ...
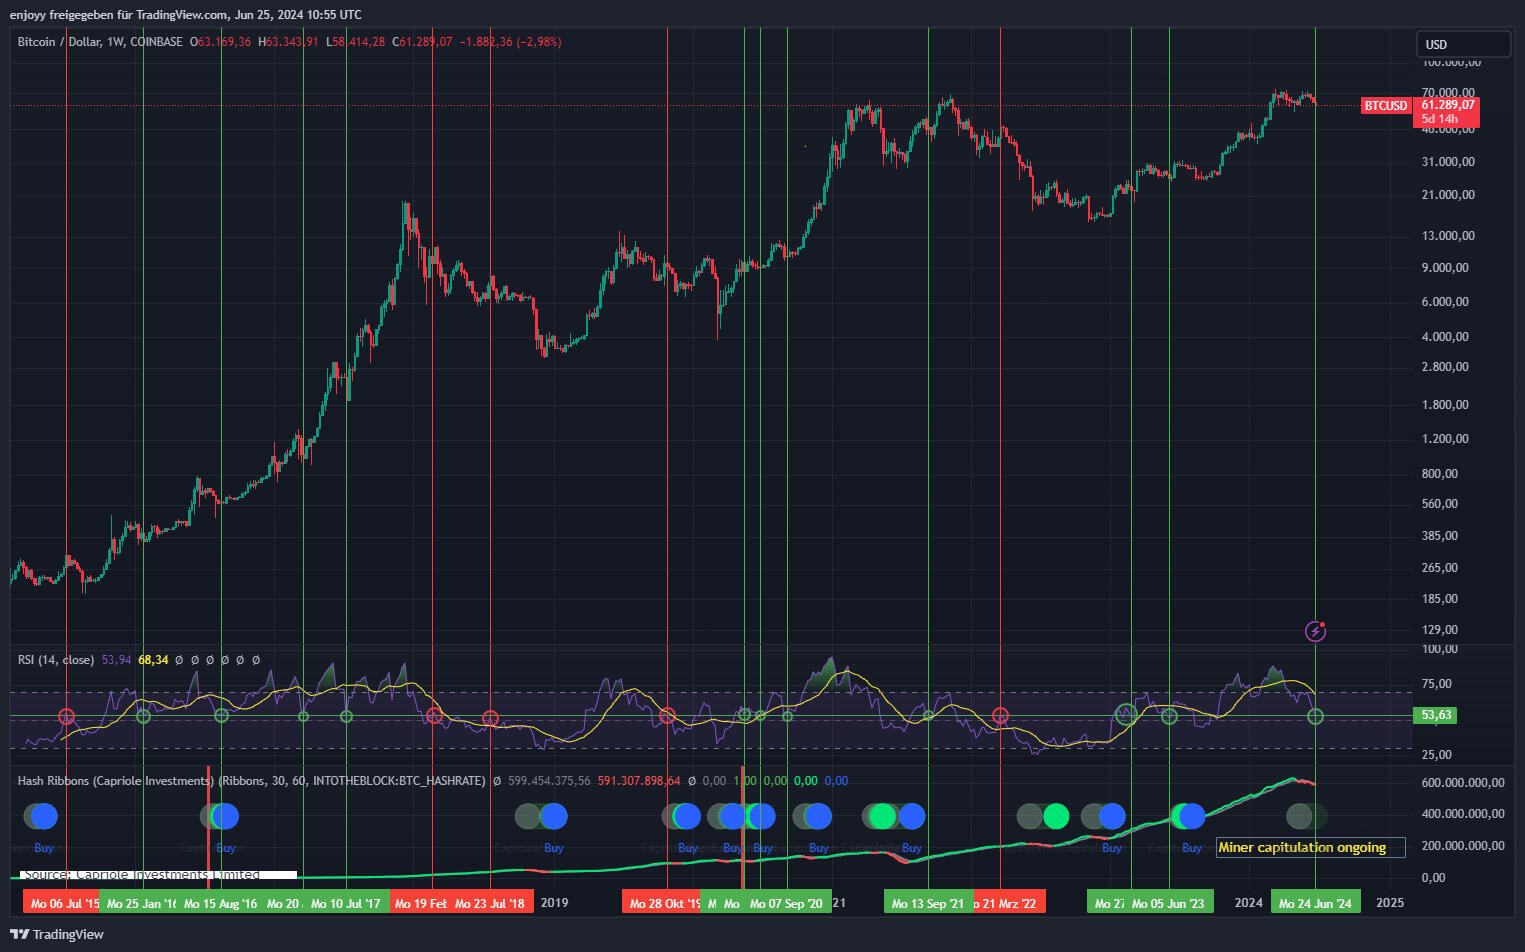
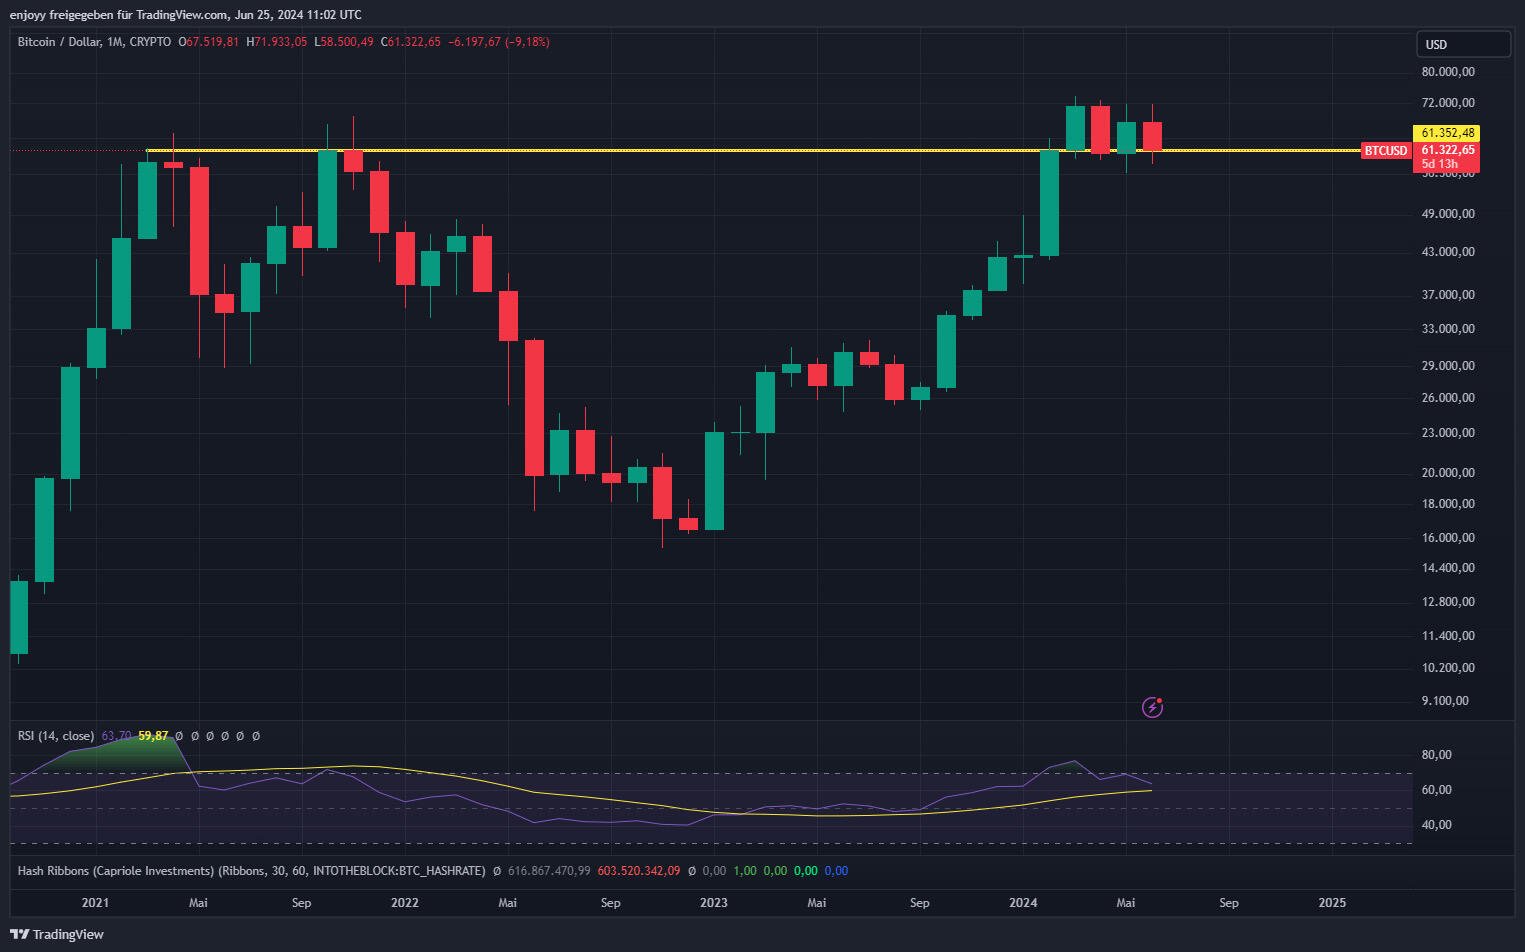
I rarely post technical content, as I prefer focusing on #Bitcoin fundamentals rather than price movements. However, the current technicals are aligning to form an extremely bullish outlook.
The weekly RSI level has often acted as a support/resistance level in Bitcoin's history. Additionally, miner capitulation is underway, which is usually followed by a hash ribbon buy signal - a historically strong indicator. There's also potential bullish divergence on both the weekly and monthly charts. Furthermore, the monthly chart is just holding above the last cycle's all-time high (candle closing, see second picture).
Those selling now will likely regret it in a few months.
Published at
2024-06-25 13:15:08Event JSON
{
"id": "df2110b0a287b2218f9cb1b620a678723359f2c64d106edd7fb23b75f1b54982",
"pubkey": "b93049a6e2547a36a7692d90e4baa809012526175546a17337454def9ab69d30",
"created_at": 1719314108,
"kind": 1,
"tags": [
[
"imeta",
"url https://image.nostr.build/2cf2f853f89fbfc9280827e6a2b4827a794f6eb3791595c22dc2b53969f6ff41.jpg",
"blurhash e24o7yxas.O=sr8{Efw}RQs+~Vt7oJXln,D,I;xGaMs--ixZogkVjG",
"dim 1525x952"
],
[
"imeta",
"url https://image.nostr.build/b610de02c5944898cbd35d10e79f03fe4522eecb4fb2d36467db9e6dc6e6e6bb.jpg",
"blurhash e14n_T%Mtk7xTc}?af$jFdNHxII==K#UVZ9uEgxa#TxGEgShEgnj%L",
"dim 1525x952"
],
[
"t",
"bitcoin"
],
[
"r",
"https://image.nostr.build/2cf2f853f89fbfc9280827e6a2b4827a794f6eb3791595c22dc2b53969f6ff41.jpg"
],
[
"r",
"https://image.nostr.build/b610de02c5944898cbd35d10e79f03fe4522eecb4fb2d36467db9e6dc6e6e6bb.jpg"
]
],
"content": "I rarely post technical content, as I prefer focusing on #Bitcoin fundamentals rather than price movements. However, the current technicals are aligning to form an extremely bullish outlook.\n\nThe weekly RSI level has often acted as a support/resistance level in Bitcoin's history. Additionally, miner capitulation is underway, which is usually followed by a hash ribbon buy signal - a historically strong indicator. There's also potential bullish divergence on both the weekly and monthly charts. Furthermore, the monthly chart is just holding above the last cycle's all-time high (candle closing, see second picture).\n\nThose selling now will likely regret it in a few months. https://image.nostr.build/2cf2f853f89fbfc9280827e6a2b4827a794f6eb3791595c22dc2b53969f6ff41.jpg https://image.nostr.build/b610de02c5944898cbd35d10e79f03fe4522eecb4fb2d36467db9e6dc6e6e6bb.jpg ",
"sig": "f33ad92ce6d776194c4225ed6f7cd2f26bb49e863afa85fb46b5e0d514bb66381965ae26236776614a67304cac994f4dec7c0559674b132c66780f9a93bcb771"
}
