The Bollinger Bands indicator can be used to identify support and pressure levels for price. The Bollinger Band indicator is made up of three lines, the upper, middle and lower rail lines. The upper and lower lines are the pressure and support levels of the price. The middle rail line is the average of the price. When the price is near the upper Bollinger Band line, it means that the price is in an overbought state, and when the price is near the lower Bollinger Band line, it means that the price is in an oversold state
The KDJ indicator can be used to determine the trend of the price, the KDJ indicator is composed of three lines, respectively, K line, D line and J line. K line is the price of the fast line, D line is the price of the slow line, J line is the price of the deviation line. When the K and D lines are both up, the price trend is up, and when the K and D lines are both down, the price trend is down. When the J line is at a high level, the price is overbought, and when the J line is at a low level, the price is oversold
Use the MACD indicator to determine price momentum.The MACD indicator is made up of two lines, the MACD line and the signal line.The MACD line is the fast line of price and the signal line is the slow line of price. When the MACD line and the signal line are both up, it means price momentum is up, and when the MACD line and the signal line are both down, it means price momentum is down. When the MACD line and the signal line diverge, it indicates a possible reversal of the price trend
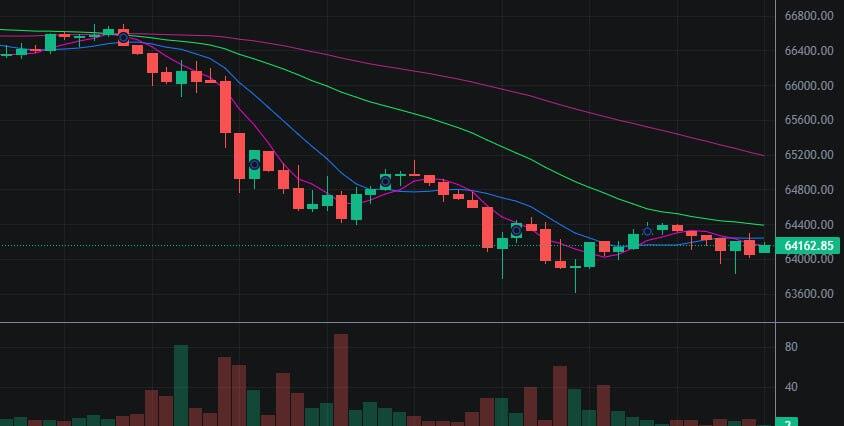
Use the volume indicator to determine price volume. The volume indicator is an indicator that reflects the volume of price transactions. When volume increases, it indicates an increase in price trading volume, and when volume decreases, it indicates a decrease in price trading volume. When volume and price rise at the same time, it indicates that the price trend is upward, and when volume and price fall at the same time, it indicates that the price trend is downward
These indicators can be used to analyze the price trend. By analyzing the price chart, the Bollinger Band indicator, the KDJ indicator, the MACD indicator and the volume indicator, we can see that the price is going long near $64,000 and short near $66,000 #nostr #bitcoin