Event JSON
{
"id": "094157f12420ae68bfdfec4a107a0cd34cd62d35625cb4457b92b4b8a96cd428",
"pubkey": "258daa31b32cd5b476640a2055c7ee797f353374af90518d28081af9126a5554",
"created_at": 1719401602,
"kind": 1,
"tags": [
[
"t",
"arctic"
],
[
"proxy",
"https://fediscience.org/@ZLabe/112682703443471099",
"web"
],
[
"imeta",
"url https://fediscience.org/system/media_attachments/files/112/682/700/977/509/195/original/3cab34f4ba49ce80.png",
"m image/png"
],
[
"imeta",
"url https://fediscience.org/system/media_attachments/files/112/682/701/810/402/883/original/31fa4e99a8836eb8.png",
"m image/png"
],
[
"imeta",
"url https://fediscience.org/system/media_attachments/files/112/682/702/742/026/589/original/0043e59ab0132ed3.png",
"m image/png"
],
[
"proxy",
"https://fediscience.org/users/ZLabe/statuses/112682703443471099",
"activitypub"
],
[
"L",
"pink.momostr"
],
[
"l",
"pink.momostr.activitypub:https://fediscience.org/users/ZLabe/statuses/112682703443471099",
"pink.momostr"
],
[
"expiration",
"1721998901"
]
],
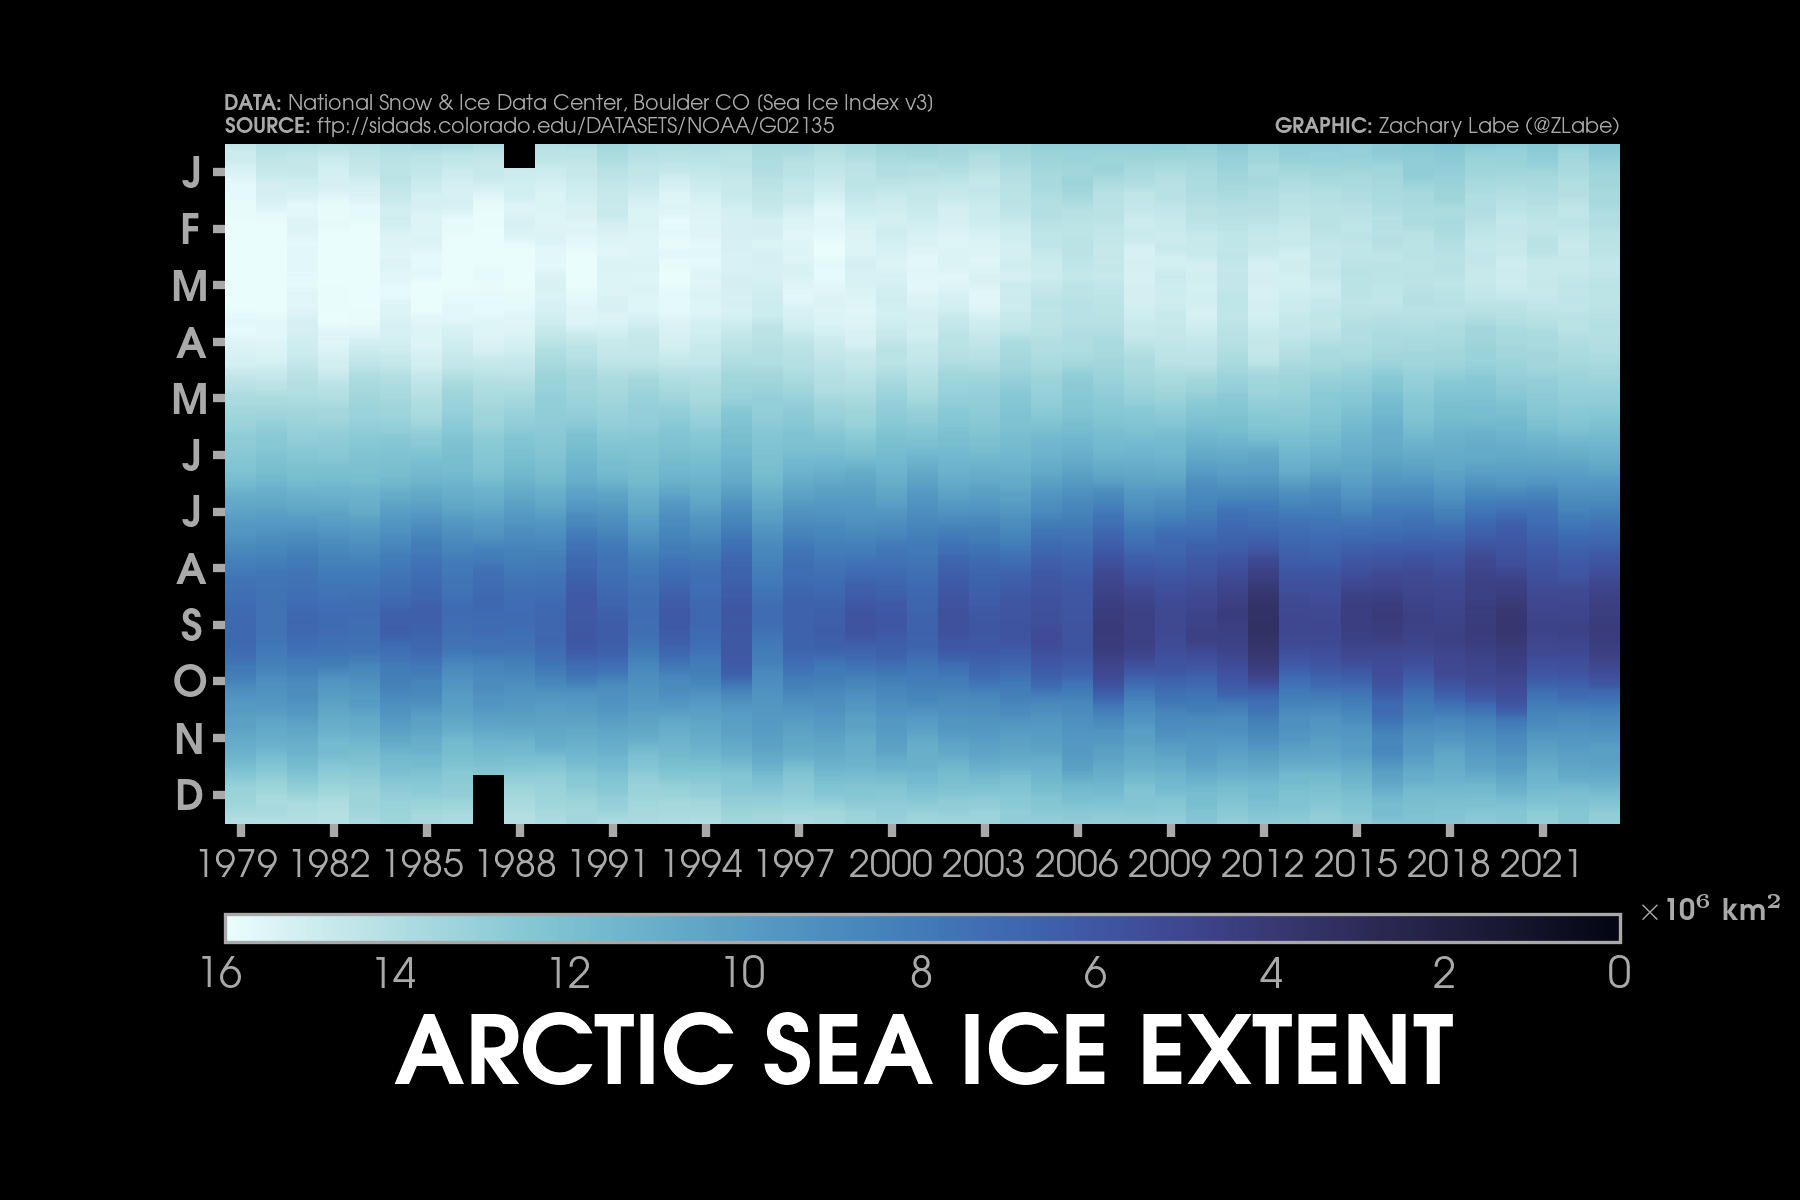
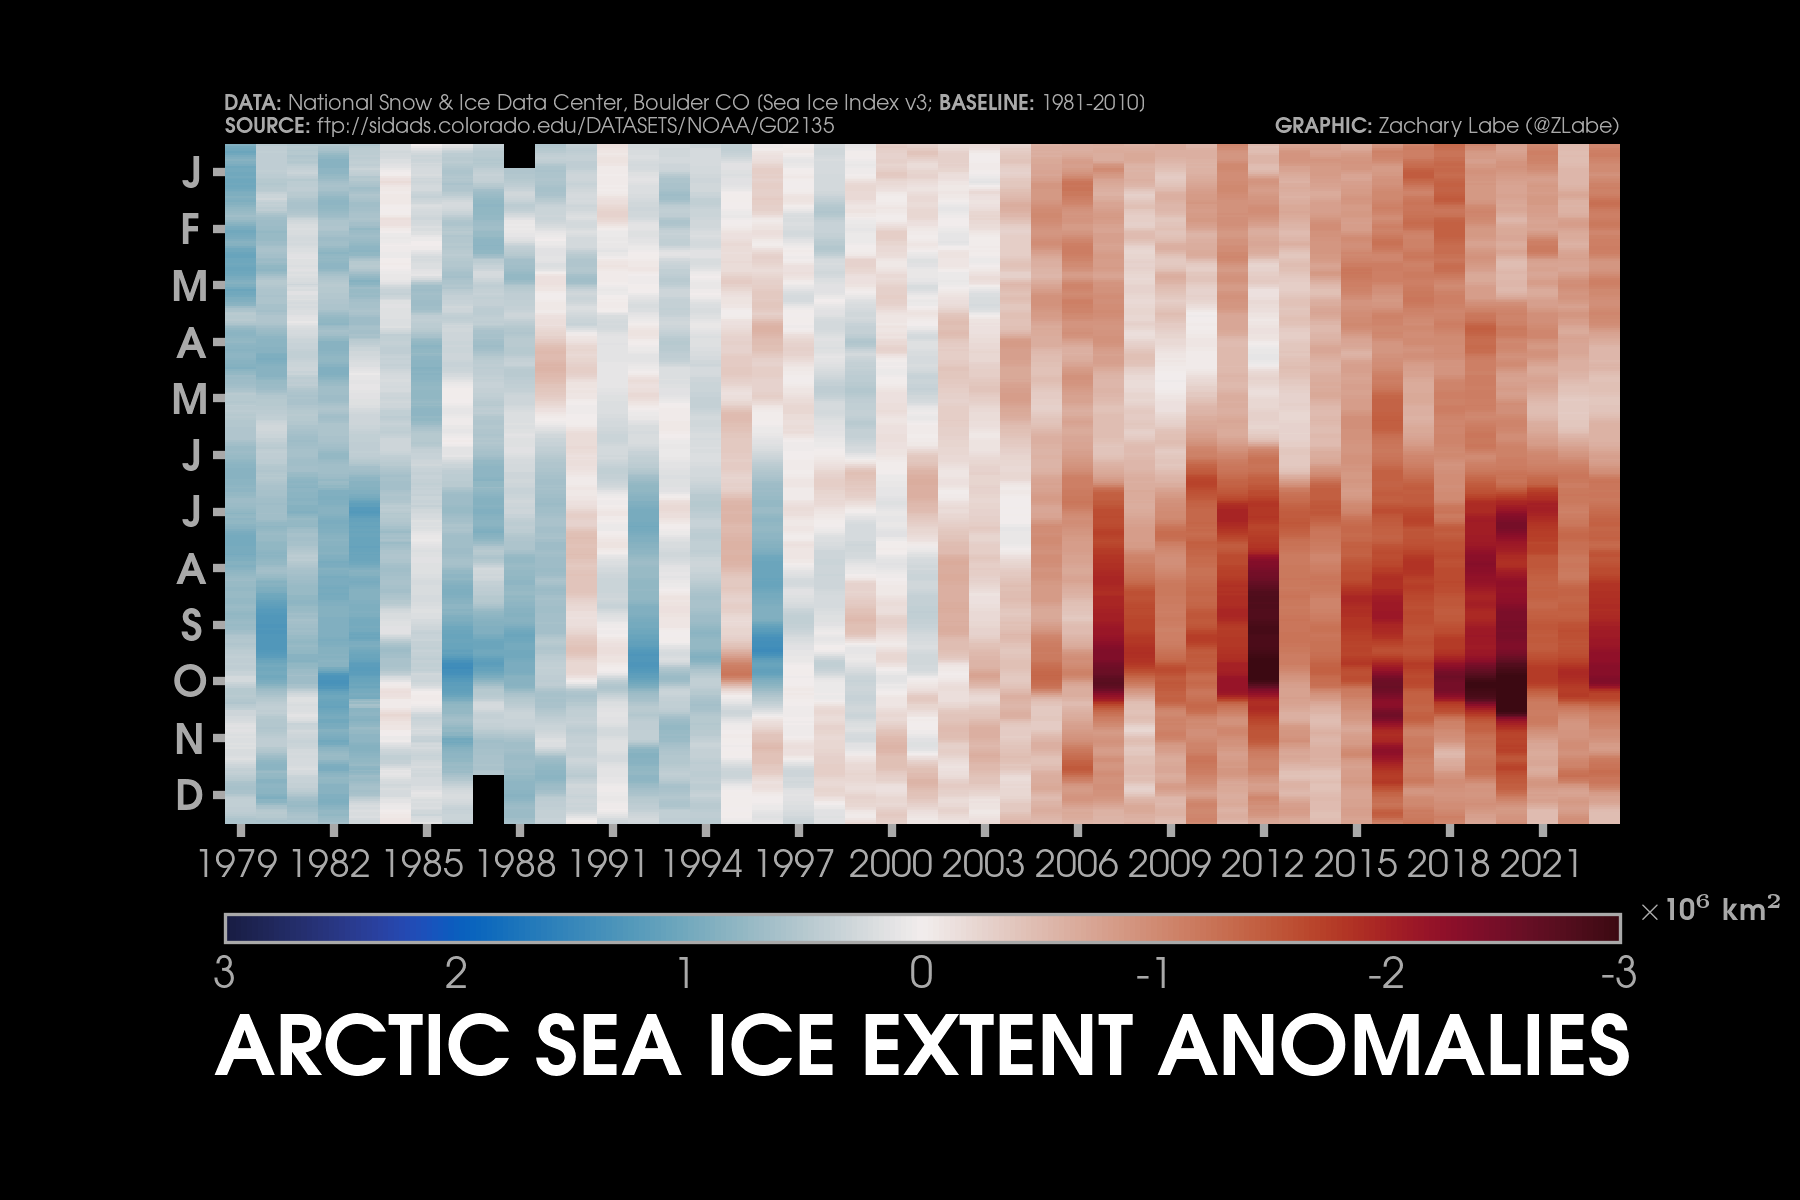
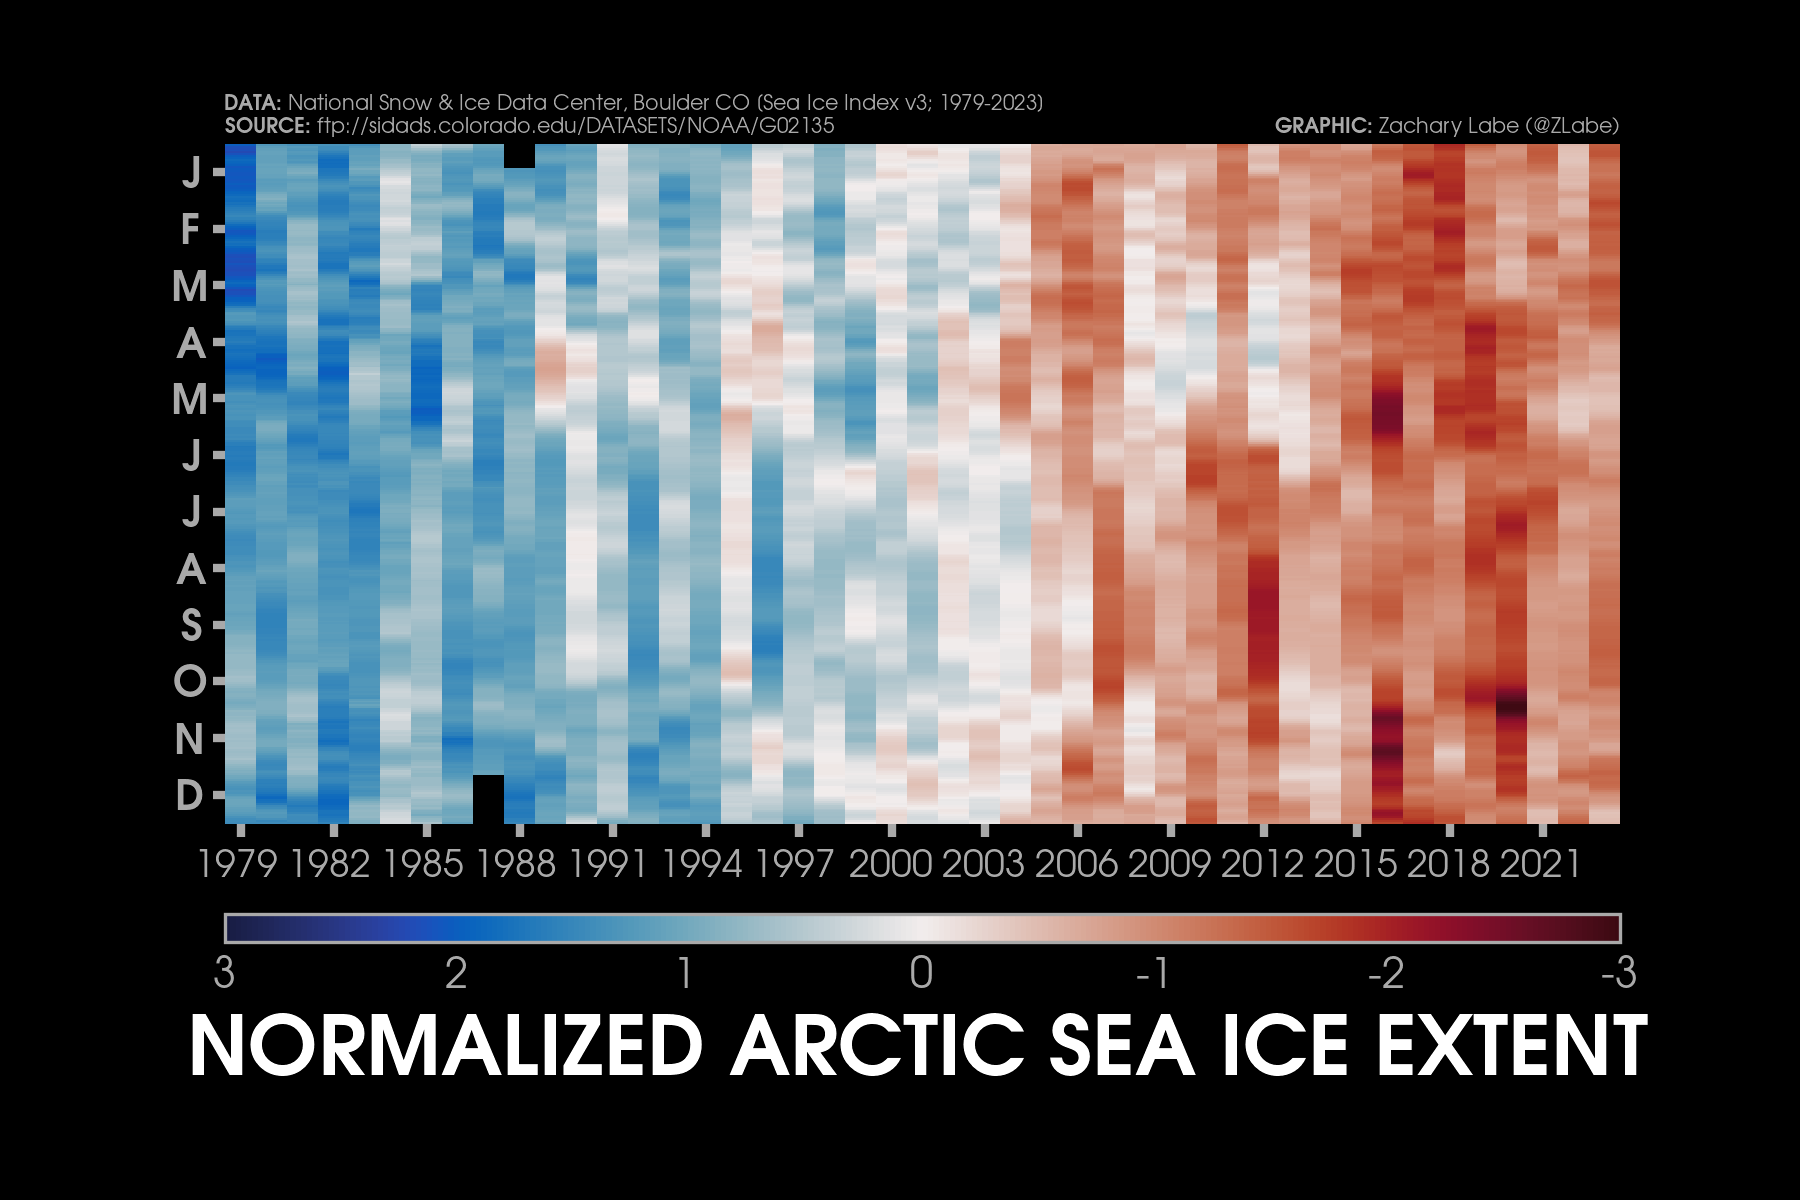
"content": "Mosaics of daily #Arctic sea ice extent, its anomalies, and its normalized anomalies from 1979 through 2023. What trends do you see?\n\n+ Download high resolution versions: https://zacklabe.com/arctic-sea-ice-figures/\n+ Data: https://nsidc.org/data/seaice_index\nhttps://fediscience.org/system/media_attachments/files/112/682/700/977/509/195/original/3cab34f4ba49ce80.png\nhttps://fediscience.org/system/media_attachments/files/112/682/701/810/402/883/original/31fa4e99a8836eb8.png\nhttps://fediscience.org/system/media_attachments/files/112/682/702/742/026/589/original/0043e59ab0132ed3.png\n",
"sig": "b05da2044e0d7c3c4212f9d477c4ded71fefc81abdba2bc12600a865a0b16b00dcbb647c2d30d655a1a614904ec97724b386b29042a4878dac05154a213c5104"
}